
Dashboards & Reporting Systems That Make Decisions Faster
Live operational dashboards and automated reports that turn data scattered across CRM, finance, support and ops into a single, current view of the business.
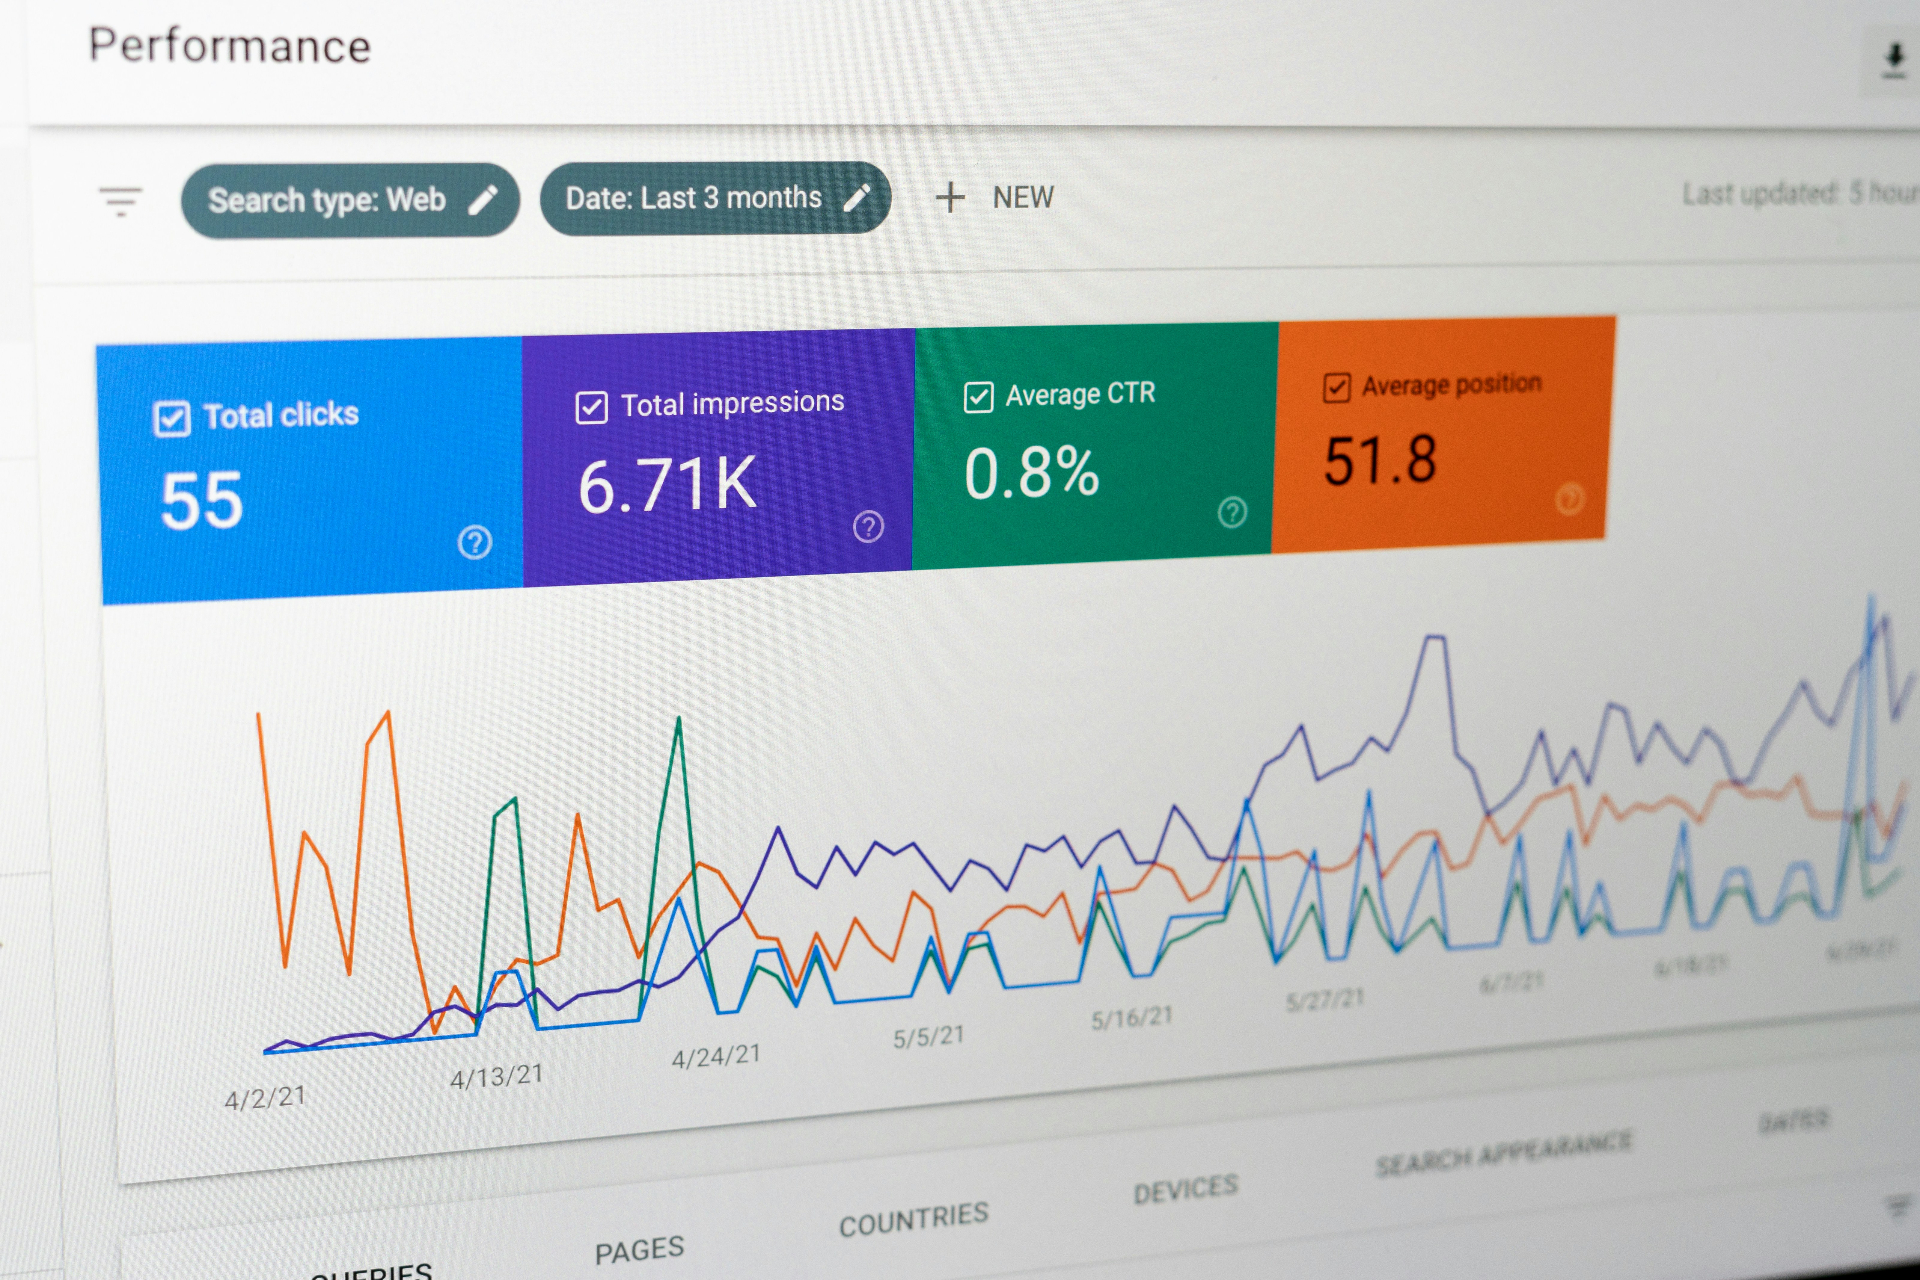
Why this matters for the business
Most leadership teams spend the first day of every week assembling the same reports from the same five tools — and by the time the deck is ready, the numbers are already out of date.
Worse, the reports usually answer last week's questions, not this week's. Anyone who needs to drill in has to ask the analyst again, who has to rebuild the report again, and the cycle never stops.
A real dashboard system pulls live data from across the business into a single view that updates itself, lets anyone drill in, and surfaces the exceptions before they become problems.
Dashboards & Reporting Systems — capabilities
Specific, production-grade capabilities — not a generic feature list.
Real-time rollups across sales, ops, support and finance — refreshed automatically.
Board-ready executive views with the right metrics, trends and commentary in one place.
Team-level scorecards for support response time, ops throughput, sales velocity and more.
Slice by team, region, product, channel or segment without rebuilding the report.
Reports land in inboxes and channels at the right time — already ready to read.
AI generates short, plain-language summaries on top of the numbers.
Custom thresholds and anomaly detection notify the right people before issues escalate.
Leadership, managers and individual contributors see the views relevant to them.
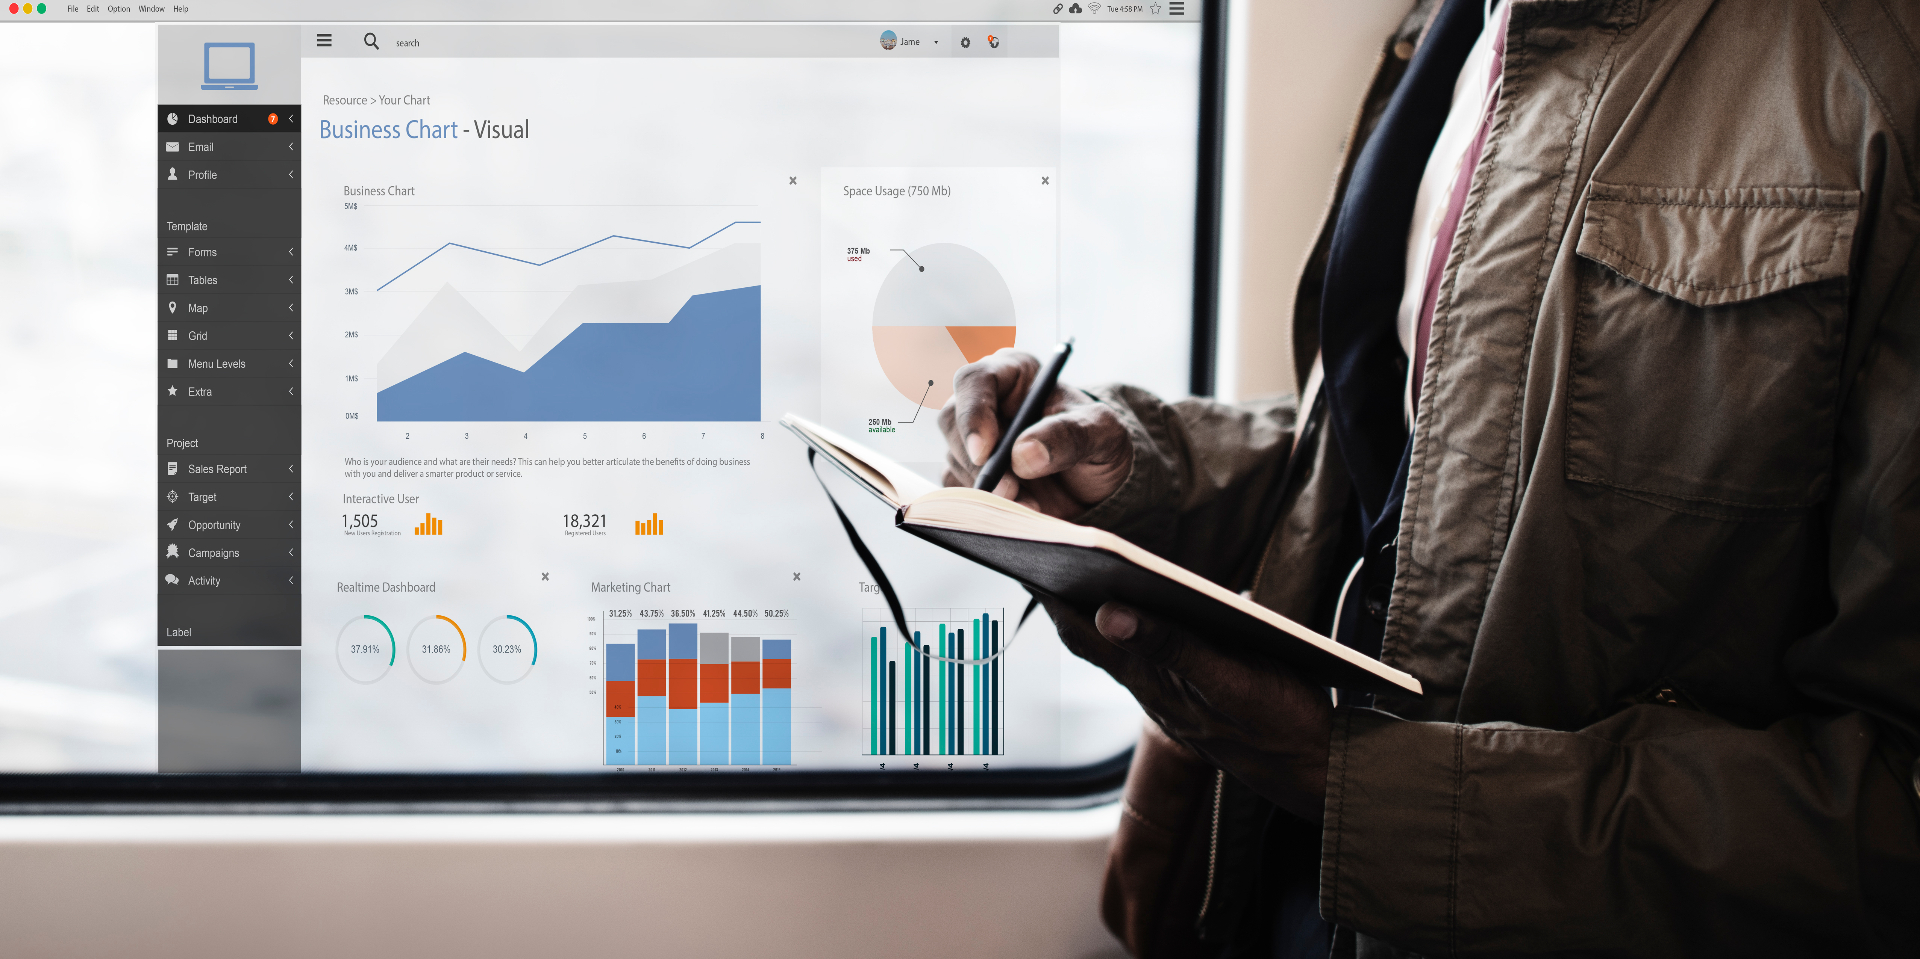
The practical result for the business
Real, measurable business outcomes — not vanity metrics.
Leadership visibility in one view, in real time
Faster decisions backed by current data
Fewer hours spent assembling reports by hand
Earlier detection of anomalies and operational issues
Where this is being used in real businesses
Sales pipeline and revenue dashboards
Support and operations performance dashboards
Finance, cash-flow and AR/AP rollups
Marketing and acquisition reporting
Executive weekly briefing with AI summaries
Customer-health and churn-risk dashboards
Field operations and logistics dashboards
A real business scenario, step by step
Monday morning — leadership opens one tab, sees the whole business
Data from CRM, finance, support and ops is pulled and consolidated overnight.
Headline KPIs and trends recalculate against the latest data.
A short narrative summary highlights what changed, what's on track and what isn't.
The summary and key metrics land in leadership inboxes and the team Slack channel.
Anyone can filter, drill in and trace a number back to its source — without analyst help.
Threshold and anomaly alerts notify the right owner the moment a metric trips.
How this fits a modern business operation
You can't run a real business on a weekly report. The team is making decisions all day; the dashboard is what makes those decisions data-informed instead of vibes.
Reporting automation also removes one of the most thankless jobs in any company — manually assembling the same report every week, forever.
Done right, the dashboard becomes the operating cockpit of the business.
How we deliver every engagement
Discover → Map → Design → Build → Integrate → Test → Launch → Optimize
- 01Discover
Understand the business problem, current systems and the outcome that defines success.
- 02Map
Map workflows, data and integration points end-to-end so nothing is invented blind.
- 03Design
Design the system, user flows and data model around the real operating reality.
- 04Build
Engineer the application, automations and AI components with production quality from day one.
- 05Integrate
Connect to CRM, ERP, payments, support and internal tools with reliable two-way sync.
- 06Test
QA, UAT, performance and security checks against the success metric defined up front.
- 07Launch
Ship the system with monitoring, alerting, training and a clean rollout plan.
- 08Optimize
Measure outcomes, tune flows and expand the system as adoption grows.
Common questions about Dashboards & Reporting Systems
Have a workflow, app, portal or automation in mind?
Tell us the business problem, the systems involved and the outcome you want. We'll help shape it into a practical digital solution.